Monitoring software for Raspberry Pi
Raspcontrol
Raspcontrol [7] was one of the first monitoring solutions designed specifically for Raspberry Pi, and it has gradually matured to a user-friendly tool that provides key stats in an easy-to-digest form. Similar to PhpSysInfo, Raspcontrol is written in PHP, so it also requires the Apache web server and PHP, and the application is relatively easy to deploy.
The recommended way to obtain the latest version of Raspcontrol is to clone the project's GitHub repository. To do this, install Git on your Raspberry Pi, switch to the var/www directory, and clone the project's repository:
sudo apt-get install git
cd /var/www
git clone https://github.com/Bioshox/Raspcontrol.git raspcontrol
Next, you can create the etc/raspcontrol directory with the mkdir command then create and open the database.aptmnt file for editing in the nano text editor:
sudo mkdir /etc/raspcontrol
sudo nano /etc/raspcontrol/database.aptmnt
Enter the following code into the database file, replacing the placeholders with the desired username and password:
{
    "user":       "USERNAME",
    "password":   "PASSWORD"
}
Save the file and change the permissions of both the file and the directory with:
sudo chmod 777 /etc/raspcontrol
sudo chmod 777 /etc/raspcontrol/database.aptmnt
Now, you can point the browser to http://<rasp-pi_IPaddress>/raspcontrol and log in using the specified credentials.
Raspcontrol features a simple interface in three sections. The default Home section provides basic info – uptime, hostname, IP address – with shortcuts to specific sections in the Details section (Figure 5). Click on the check mark next to the RAM entry, for example, to view RAM info in the Details section.
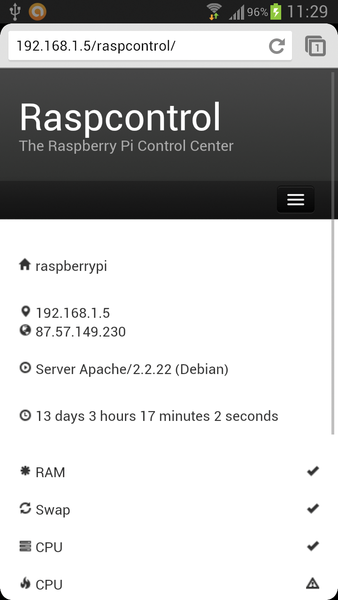 Figure 5: Raspcontrol features a responsive interface, too.
Raspcontrol makes extensive use of graphs for presenting data, and some graphs have a clever hidden trick: Mousing over a graph displays a pop-up window containing useful information. For example, the pop-up window in the RAM graph shows the Top RAM eaters list, which can be helpful for identifying applications and processes that consume a lot of RAM (Figure 6). The Services section displays a list of all running and stopped services. Although Raspcontrol doesn't let you start and stop services, this section can help you quickly find out whether a specific service is active or not.
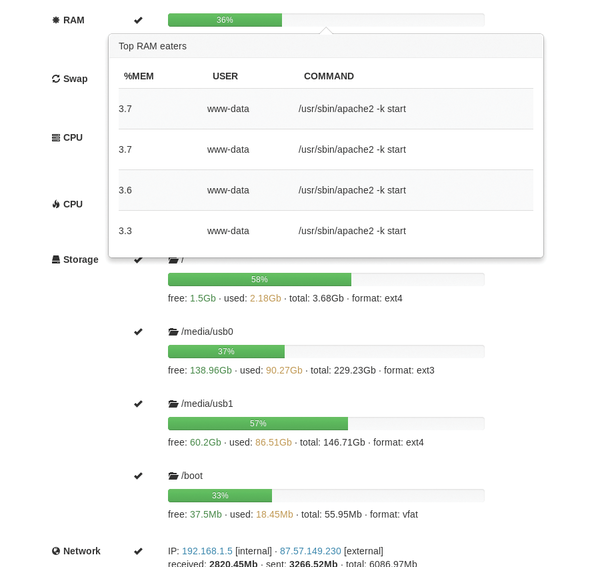 Figure 6: Raspcontrol gives you useful morsels of information.
Similar to RPi-Monitor, Raspcontrol features a responsive interface that works well on small screens. That means that you don't need a dedicated app to view stats on your Android device.
Raspberry Stats
Raspberry Stats [8] is a rather basic monitoring application in terms of functionality. As such, it can be a perfect fit for users who are looking for a no-frills solution that provides a quick overview of the most essential info (Figure 7). Raspberry Stats is based on Node.js, and the application depends on two Node.js packages. Thus, the first order of business is to install the required packages, which can be done using the command:
sudo apt-get install nodejs npm git
Next, clone the project's GitHub repository in your user home directory on Raspberry Pi:
git clone https://github.com/96AA48/raspberry-stats.git
Switch to the resulting directory and install the required packages:
cd raspberry-stats
npm install socket.io connect
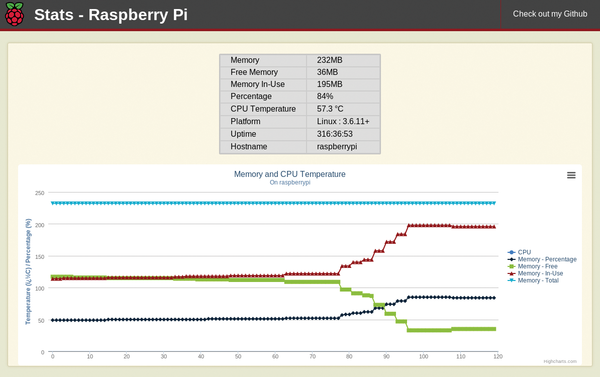 Figure 7: Raspberry Stats is a no-frills monitoring application written in Node.js.
Raspberry Stats is now installed and ready to go, but before you launch the application, you need to configure a couple of settings. By default, Raspberry Stats runs on port 80, so if you already have a web server running on Raspberry Pi, you will need to specify a different port. To do this, open the app.js file in a text editor, locate the var server_port parameter, and specify the desired port. Save the changes, open the web/client.js for editing, locate the var server_location parameter, and specify the correct IP address or domain name of the Raspberry Pi server. Now you can start Raspberry Stats with the following command:
sudo nodejs app.js
Although Raspberry Stats is light on features, the application provides an overview of essential aspects like memory usage, CPU temperature, and uptime. It also features graphs that display CPU load and memory usage.
« Previous 1 2 3 Next »
Buy this article as PDF
Pages: 4
(incl. VAT)
Buy Raspberry Pi Geek
US / Canada
UK / Australia
Related content
-
Android Pi

Your Android device can be a versatile companion for Raspberry Pi. We describe some useful apps to help you make this happen.
-
All the Pi
Raspberry Pi users think small and dream big, imagining ingenious projects that put the unobtrusive Raspberry Pi to work on practical problems. And along the way, they learn things you don't ever discover by pointing and clicking with a smartphone or MacBook.
-
Creating a 3G hotspot with the Raspberry Pi

WiFi is available for free in so many public places that Internet access via a UMTS mobile cellular system would appear to be unnecessary. However, a Raspberry Pi with a UMTS stick can create a personal hotspot that creates independence from public WiFi networks.
-
Access and control Raspberry Pi remotely with RaspCTL

Need to access and control a remote Raspberry Pi machine? RaspCTL can help with that, and we show you how to deploy and use the software.
-
Monitoring Raspberry Pi temperatures

Retrofitting a Raspberry Pi with a cooling element does not cost much; however, does the Rasp Pi really need one?
