Graphing Tool
We show how to use lists in Scratch to collect resistance measurements and graph the results with the pen tool.

Lead Image © kudryashka, 123RF.com
We show how to use lists in Scratch to collect resistance measurements and graph the results with the pen tool.
Scratch has long been able to connect to the physical world by way of a PicoBoard, which is an external device that plugs into the USB port of a computer or a Raspberry Pi. The PicoBoard [1] measures resistance, sound, and button clicks and includes a slider control. In this project, I'll show you how to use a PicoBoard's alligator clips to measure resistance, and just to kick up the experiment a bit, I'll use a thermistor to measure the resistance of water as it warms or cools.
A thermistor is a type of resistor that is often used to measure temperature because its resistance varies significantly based on the temperature. Thermistors can be found at an electronics supply store or purchased from online retailers.
To set some context and purpose, this project can be used as an experiment to observe how evenly the water heats up or cools down. Is the process subtle or abrupt? If you're measuring boiling water, what happens to the temperature after the water boils? Additionally, the project can be scaled back and used to measure the resistance of individual objects. You can download my sample project complete with a text file of measurements online [2].
The Steinhart-Hart equation [3] provides a way to convert resistance to a temperature; however, that will not be the focus of this exercise. Resistance is measured in ohms, whereas Scratch measures resistance on a scale of 0 to 100, with 100 representing the highest resistance possible (no current). By graphing the resistance of the thermistor, you can extrapolate information about what is happening with regard to temperature. An increasing temperature will result in decreasing resistance and vice versa.
From a Scratch programming perspective, I will show you how to collect the measurements at defined intervals and store them in a list for later retrieval. The second part of the programming exercise will retrieve the measurements from the list and graph the results. The use of lists and the pen tool will be the main Scratch topics.
After you have acquired a PicoBoard (Figure 1, you can plug it in to an available USB port on your Pi. The Pi detects the device automatically. Next, open Scratch, or restart Scratch if it's already open. Scratch automatically detects the PicoBoard and makes the () **sensor value and sensor **() **? blocks available in the Sensing palette. Scratch interacts with the sensors on the PicoBoard through these two blocks.
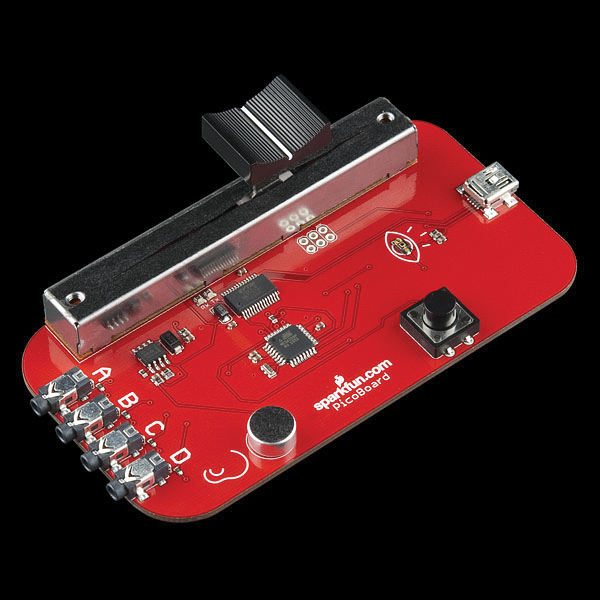 Figure 1: The PicoBoard from SparkFun.
The board contains four ports labeled A, B, C, and D, and each port takes a set of alligator clips. From the Sensing palette, select resistance-B as the value in the () **sensor value block. Although you can actually select any port for this exercise, I use port B because A is broken on my board. Next, click the checkbox next to the block to enable the stage monitor. Assuming the alligator clips for port B on the PicoBoard are not touching, the block should report a resistance-B value of 100.0.
If you complete the circuit by connecting the two clips on port B together, the resistance drops to 0.0 – meaning the circuit is complete with no resistance. Next, connect one alligator clip to one lead of the thermistor and the other alligator clip of the same port to the second lead of the thermistor; you get a new resistance value.
Each set of alligator clips can only be used on the port into which it's plugged. If you try to connect the thermistor using one alligator clip from port A to one alligator clip on port B, you will not make a circuit, and resistance will always be 100.
If Scratch fails to detect the PicoBoard by not registering resistance values, try restarting Scratch and make sure you do not have multiple instances of Scratch open, because that will cause conflicts. I've never had problems detecting the PicoBoard on my Pi, but if you do experience problems, try starting Scratch from a terminal window with the command scratch and look in the terminal window for clues. You can also watch syslog for problems: Disconnect the PicoBoard, use the command tail /var/log/syslog -f from a terminal window, then plug in the PicoBoard and watch for errors.
In this experiment, I'm going to measure the change in resistance to the thermistor over time, but before I can worry about what to measure, I need a framework to collect the data. The collection script uses Scratch's built-in timer to set the collection interval and store each recorded resistance value to a list.
As a prerequisite to the script, create a list named measurements. To create a new list, click the Make a list button in the Variables palette. Lists are another name for arrays, and they can have a global or local scope. When you create a list, Scratch will prompt you to make the list available For all sprites or For this sprite only. Scratch defaults to the For all sprites option.
Just as when you create a variable, Scratch makes available several new Variable blocks when you create a list that makes it possible to add, remove, and work with the items in the list. Each item in the list is accessible by a numbered index.
If this is your first exposure to lists (arrays), it might help to think of them in terms of a to-do list. On a to-do list, you have a list of items to accomplish. You may add items throughout the day or remove completed items. Listing 1 shows the complete collection script.
Listing 1
Complete Collection Script
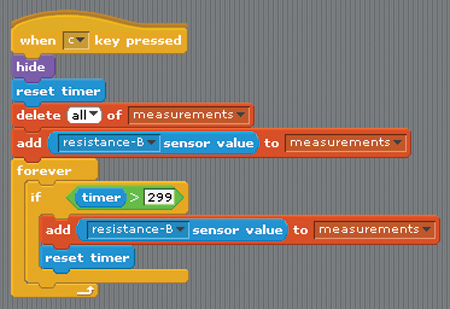
I like to start data collection by pressing the C key, because it involves a deliberate effort to run the script. In my first versions of this script, I used the when <green flag> clicked block as the event to initiate the collection. However, I instinctively click the green flag in Scratch projects and, after I lost my first set of collected data, I made the change to the C key.
Other notable parts of the script are the hide block. The actual sprite is not important and the first thing to do after pressing the C key is to hide the sprite, so programming your script on the default cat sprite is just fine. The reset timer block resets the built-in timer to 0 and immediately starts counting up again like a stopwatch. You can ensure that you start with an empty list by using the delete (all) of (measurements) block.
After you wipe any stored data from the measurements list, you can take the first resistance measurement and add it to the list at position one by using the add ((resistance-B) sensor value) to (measurements) block.
The forever block and the if ((timer) > (299)) evaluation set the collection interval. The example in Listing 1 collects the resistance every five minutes (or 300 seconds) and adds it to the list. Then, the timer is reset and the script waits for the next 300 seconds to elapse.
This script runs forever, in that no condition is specified in the script to stop the collection. The current script relies on you to click the stop sign in the Scratch project editor to halt the collection. This approach has worked well for me in the contexts in which I've used the script.
Depending on what I want to measure, I can adjust the value in the timer > () evaluation to correspond to what I'm doing. If I'm measuring boiling water, for example, I know my experiment will only last 20 minutes or less, so I can collect a sample every minute. Additionally, I'm definitely not going to leave my water unattended, which means I'll be available to stop the script manually. On the other hand, if I'm allowing ice water to warm up to room temperature, a longer collection interval will make sense, but I might not know how long to let the script run. In one of the example graphs that I'll show, I let my collection script run for nearly 11 hours while recording data every five minutes.
In other words, I'm OK with an infinite loop for my data collection.
Pages: 4
US / Canada
UK / Australia

This project uses the slider, light sensor, and resistance sensors on the PicoBoard to connect your Scratch project to the physical world. The two examples create musical fruits and veggies and a PicoBoard joystick.

Stop-motion animation doesn't require expensive cameras and movie editing software. With Scratch and a Pi camera, you can become your own director, producer, and publisher.

With the help of an existing project, we show you how to program scrolling sprites in a series or in a continuous loop.

We show how to use Scratch sprites to shoot at various targets.

This article draws inspiration from the popular Pokémon Go app to recreate a sprite hunting game in Scratch. The project explores synchronization and randomness as the player explores various backdrops in search of sprites.

Price $15.99
(incl. VAT)