Connecting a weather station to your Arduino
Overflowing 32-Bit Integers
While testing the SDL_Weather_80422 class, I noticed an odd bug. The wind speed worked perfectly for 36 minutes and then stopped working. I immediately realized what must be going on. I was counting microseconds with a 32-bit signed integer, and ((2 31)/1000000)/60 microseconds equals almost exactly 36 minutes. I was overflowing my counter. How do you solve this? Two ways. One, you can look for the rollover and deal with it in code (which is ugly), or you can use unsigned long integers.
The problem is that when you look for an interval of say 5,000 microseconds and the counter rolls over, you get a negative time. Not good. The trick here is to make sure the variables involved in the time interval calculation are unsigned long variables, such as shown in this example:
micros() returns Number of microseconds since the program started (unsigned long)
unsigned long _startSampleTime;
 _timeSpan = (micros() - _startSampleTime);
The mathematics of the case in which micros() has rolled over in unsigned arithmetic magically produces the correct positive value (because unsigned longs have no negative values). Problem solved. This is all nicely explained on the Utopia Mechanicus website [14].
Building the Control Panel
As with any project, I like to build control panels. I need to see and visualize what is going on in my device both locally and remotely. This project is no different. To design and implement this control panel on an iPad or iPhone, I am using a nice app called ArduinoConnect [15] to build the control panel. I have written about the sister app, RasPiConnect, in my articles on MouseAir [4] and BeaconAir [16]. I have now built seven different control panels for a variety of projects with this app, and I'm very pleased with it.
It turns out that you can mix both Arduinos and Raspberry Pis inside this application at the same time. In this case, because I am only using an Arduino in this article, I will use ArduinoConnect (Figure 7).
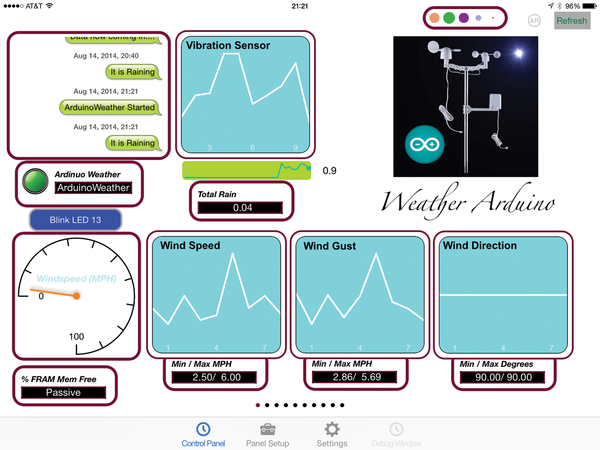 Figure 7: ArduinoConnect control panel.
Building all the controls in the app was pretty easy; then, implementing the code on the Arduino for talking to the controls was pretty straightforward. The MiloCreek website [15] has good documentation and examples, and the SwitchDoc Labs website has some of my examples [17].
I will just talk about implementing one control to give you a flavor of the process. In the ArduinoConnect Panel Setup screen, I set up a Simple Line Graph control (Figure 8) and connect it to the control ID SLGL-1, as seen in Listing 6. Very simple. This routine is executed when ArduinoConnect asks the Arduino for a refresh of the control.
Listing 6
Implementing an ArduinoConnect Control
01 void ExecuteLocalSIMPLE_LINE_GRAPH_LIVE_UITYPE(char returnJSON[], char *buffer, currentObjectStructure *parsedObject)
02 {
03
04     // SLGL-1 returns the current wind speed graph
05   if (strcmp(parsedObject->ObjectServerID, "SLGL-1") == 0)
06   {
07     if (strcmp(parsedObject->Validate, "YES") == 0)
08     {
09       // send validated response
10       returnJSONValidateResponse(returnJSON, returnJSON, parsedObject);
11
12       strcpy(returnJSON, buffer);
13       return;
14     }
15
16     char responseData[200];
17
18     sprintf(responseData, "%s", windSpeedBuffer);
19
20     returnJSONResponse(returnJSON, returnJSON, parsedObject, responseData );
21
22     strcpy(returnJSON, buffer);
23     return;
24   }
25
26 }
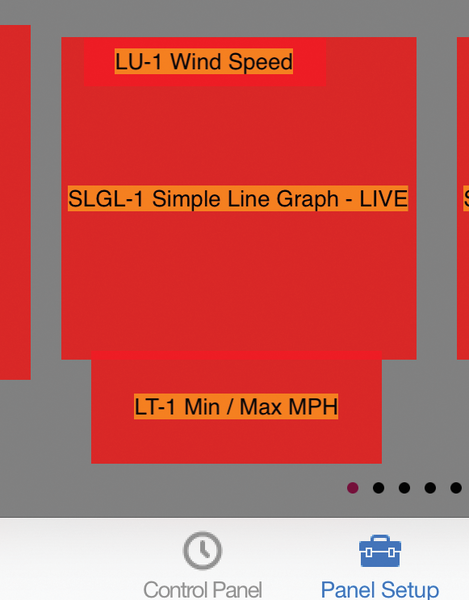 Figure 8: A Simple Line Graph control.
Next, I set up a web server on the Arduino and test it as shown on the MiloCreek website [15] (Documentation | Getting Started | 1.2.2 Setting up the ArduinoConnectServer). Once this is done, I add custom code to the Local.h file (which is equivalent to the Local.py file for RasPiConnect).
The important statement in Listing 6 is line 18:
sprintf(responseData, "%s", windSpeedBuffer);
What is windSpeedBuffer? It is a string containing the values needed to set the graph. According to the ArduinoConnect documentation, it should be a string formatted as shown in the "Simple Graph LIVE Input and Response" box [18].
Simple Graph LIVE Input and Response
Response for Simple Graph LIVE
Returns string values of data and labels to generate the graph
Returns A^^….||N^^…..
Where:
A… is floating point data
N… are labels for the X Axis
example return:
68672.000000^^17457.000000^^16954.000000^^723.000000^^10874.000000^^10367.000000^^\
  59561.000000^^56276.000000^^6379.000000^^40763.000000||1^^2^^3^^4^^5^^6^^7^^8^^9^^10
The example return is all one line with no embedded new lines. I have written a class to generate a moving graph with the results in this format. It is called SDL_RasPiGraphLibrary and is located on GitHub [19]. To use this class, you first allocate a buffer:
char windSpeedBuffer[150]; // wind speed graph
then instantiate the class:
SDL_RasPiGraphLibrary windSpeedGraph(10,SDL_MODE_LABELS);
This puts a maximum of 10 values in the graph. You need to make sure that windSpeedBuffer is large enough for the number of values you have plus the labels. Print it out and count it! If you don't allocate enough room in the buffer, it will overflow into other variables, making your program fail.
Finally, in the main Arduino loop, wherever you want to add data to the graph you use,
windSpeedGraph.add_value(currentWindSpeed);
then put the latest graph string into the buffer:
windSpeedGraph.getRasPiString(windSpeedBuffer, windSpeedBuffer);
The next time ArduinoConnect asks for a SLGL-1 update, it has the latest data to display. Turn on the LIVE feature and you have some real action on your control panel. You can look at the ArduinoConnect Server code [20] to see how to use the Bubble Table Control, the Speed Gauge, the Sparkline Plots, and the various labels and status displays. There is a lot more to the ArduinoConnect app, but this is all I am using at this time.
You can add more buttons and LEDs to suit your application and have up to 10 control panel screens. I use seven on Project Curaçao; I have asked MiloCreek to implement a polar graph control (for use with wind direction – basically a compass rose) in the next version, and they have agreed. If I get impatient, I may implement one using their Webview control, as I did with the house map in BeaconAir.
The ArduinoConnect configuration file and all the custom code for the ArduinoConnect app are posted on the SwitchDoc GitHub site [20]. The first WeatherArduino system (Figure 9) is being installed in Project Curaçao [21], with an upgrade [22] scheduled for late September 2014.
 Figure 9: The WeatherArduino system.
Buy this article as PDF
(incl. VAT)
Buy Raspberry Pi Geek
US / Canada
UK / Australia
Related content
-
Mixing wind turbines with the tropics

We describe the further saga of Project Curaçao, a Raspberry Pi-based weather station powered by wind and sun.
-
Erratum: WeatherArduino
Issue: Raspberry Pi Geek 07Article: WeatherArduino
Page: 62
-
Sending your data through the air

Build a low-powered wireless system for your outdoor weather station using inexpensive hardware.
-
Protect your electronics from lightning strikes

Add a lightning detector to your vulnerable projects via the I2C bus to protect them from electrical storms.
-
Sizing a wind turbine to power your Raspberry Pi

Got a special project for your Raspberry Pi that requires it to operate off the electrical grid? If solar power doesn't provide enough juice, add some wind to the mix with an inexpensive wind turbine.
