Oscilloscopes and mixed-mode logic analyzers
What is a Mixed-Mode Logic Analyzer?
I discussed the Saleae Logic 8 in the previous SwitchDoc Labs column [1]. In this article, I am looking at their brand new Saleae Logic Pro 16 logic analyzer (Figure 6), which costs $599. (Disclaimer: The folks at Saleae were good enough to send me one to work with for this article.) Now that I've used it for a while, I can definitely recommend purchasing one. It is a good, solid piece of equipment.
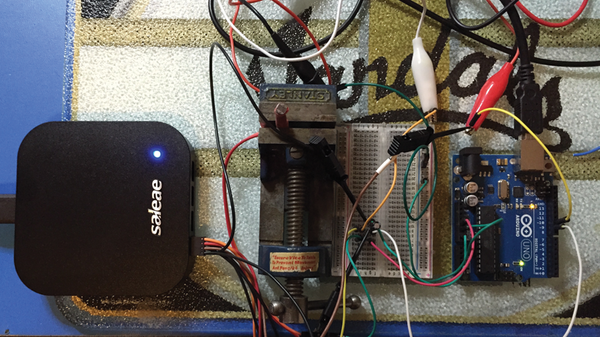 Figure 6: Saleae Logic Pro 16 mixed-mode logic analyzer.
A logic analyzer is a test instrument that captures and displays multiple signals from a digital circuit. A logic analyzer converts the captured digital data (vs. analog data – see the section on oscilloscopes) into timing diagrams, decoded protocols, state machine traces, and sometimes even assembly language. Logic analyzers have triggering capabilities that can help you locate a problem and are useful when you need to see the timing relationships between many signals in a digital system. A mixed-mode logic analyzer adds one or more analog channels to the system – sort of a mix of oscilloscope and logic analyzer. The Logic Pro 16 can sample at 100MHz, which is four times faster than the Logic 8.
The rule of thumb is that you have to sample four times faster than your highest speed signal to reproduce the digital signal accurately: A 100MHz sampling rate means that your best accurate signal speed will be about 25MHz – much faster than the 6MHz bandwidth in my old Saleae Logic 8.
The user interface and triggering are very similar to the Logic 8 with some improvements. The analog capability of the Logic 16 is very handy; however, remember that you only can look at signals accurately that are at ~1.5MHz and below with the analog sampling frequency of 6.25 million samples per second. Compare that to the 50MHz capability of the DS1502E, and you can see that both tools have their appropriate usage. Because the signal here is really very slow, you can use either device and get about the same results.
The Results
Figure 7 shows the oscilloscope trace with a bright light on the photoresistor. The photoresistor value is low and thus the capacitor charges up quickly to the "0-1" threshold on the Arduino digital input, and you see the marker GPIO-GP1 turn off for a total time of about 2,000 microseconds (2,000µs). Compare this to the logic analyzer marker GPIO-GP1 on Figure 8 of about 1,500µs. The difference? The light was brighter for the logic analyzer run. Remember, a bright light decreases the resistance of the photoresistor so the capacitor charges faster, leading to a faster charge time.
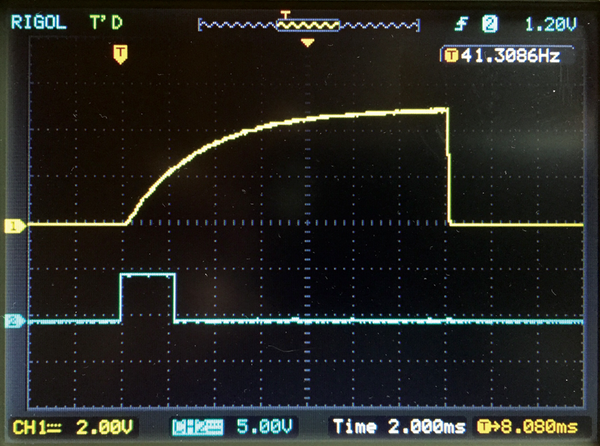 Figure 7: Oscilloscope trace with bright light.
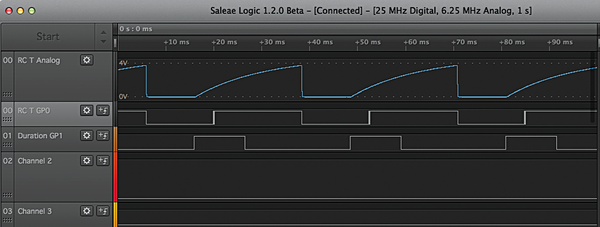 Figure 8: Logic analyzer trace with dim light.
Figure 9 shows the oscilloscope trace with a dim light on the photoresistor (I covered it with my finger). Now the GPIO-GP1 marker shows a time of about 15,000µs. Figure 10 from the logic analyzer shows about 10,000µs. The difference? The light was dimmer for the logic analyzer run than Figure 9.
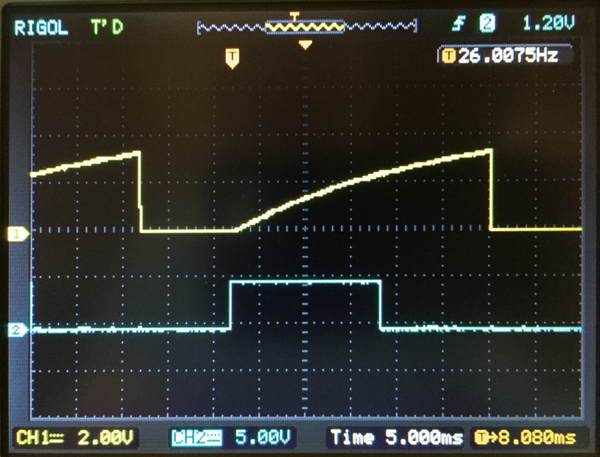 Figure 9: Oscilloscope trace with dim light.
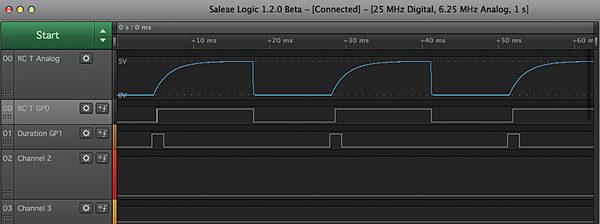 Figure 10: Logic analyzer trace with bright light.
One last comment about Figures 8 and 10 from the logic analyzer. Notice that the second trace shows the digital result (RC T GP0) picked up from the analog signal (RC T Analog). Why isn't the start of the RC T GP0 signal aligned with the Duration GP1? They are both digital signals. The reason is that the threshold voltage for the "0-1" transition on the logic analyzer is set to about 1V compared with a "0-1" transition voltage of about 2.4V on the Arduino GPIO.
« Previous 1 2 3 Next »
Buy this article as PDF
Pages: 8
(incl. VAT)
Buy Raspberry Pi Geek
US / Canada
UK / Australia
Related content
-
SunRover Part 2 – Solar Power Controller/Power System

Putting power in your robot is more than just running wires – you'll need to make sure the power supply doesn't cause interference that will disrupt other components. This article explores the problem of electrical noise and describes the design for a multiplexing solar power system.
-
Digital logic

We show how to use a logic analyzer to isolate problems in your hardware setup.
-
Digital logic

We show how to use a logic analyzer to isolate problems in your hardware setup.
-
Managing solar power systems with SunAir boards

A successful solar power project requires data analysis and the ability to modify the system to take advantage of prevailing weather conditions.
-
SunRover part 1: Track motor controller/power system

Take your first steps in building a solar-powered robot.
