Tracking airplanes in real time with ADS-B
During flight time, airliners continuously broadcast signals to identify themselves and their flight route. Countless websites utilize this data to track jets online and display their location on a map [1]. Similar programs run on mobile phones [2]. Given that a smart phone understands information about location and direction, you can use the device to create a virtual experience of receiving flight data in real time. However, these data are actually drawn from a database which the mobile phone queries via the Internet. The Raspberry Pi lets you create a low cost receiver for capturing and analyzing location data in real time, without depending on the Internet.
The receiver for this kind of set-up consists of a DVT-T stick, which is a device that was originally designed for receiving television signals via radio waves (Figure 1). The best candidate among all of the available sticks are those using the Realtek RTL2832 chip. This chip can communicate with the reception and analysis program. Well known vendors advertise suitable receivers with descriptions such as "USB DVB-T RTL-SDR Realtek RTL2832U" for a price of under 10 Euro. The antenna included with these sticks is usually sufficient for this project. If it is not, you can build a directional antenna [3] by yourself to operate at a frequency of 1090 MHz and then connect it to the stick via the MCX plug contact.
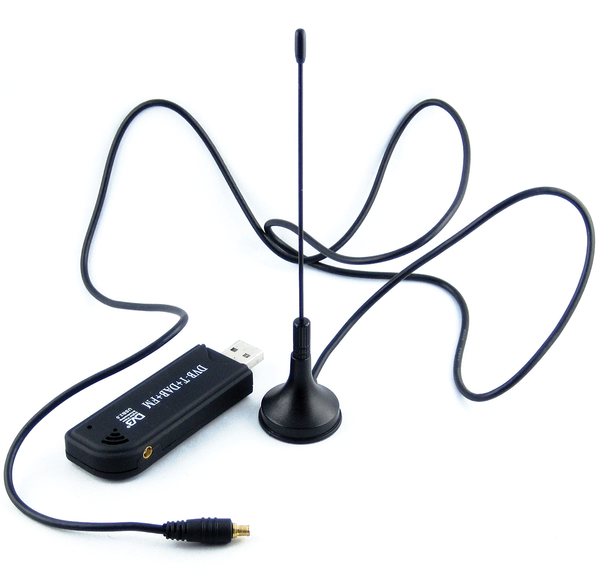 Figure 1: A simple DVB-T stick serves as the SDR receiver for the Raspberry Pi.
[...]
Buy this article as PDF
Pages: 7
(incl. VAT)
Buy Raspberry Pi Geek
US / Canada
UK / Australia
Related content
-
Taking the Raspberry Pi over hill and dale

The Raspberry Pi is the heart of many different projects, be they navigation devices or flight scanners. When equipped with a suitable keyboard and simple monitor, the little computer can also be put to use for tasks in the great outdoors.
