Detecting oxygen with an Analog to Digital Converter.
Pi Software
In order to proceed, you need to install the following three major software packages. MySQL, phpMyAdmin, Apache web server, apscheduler, MatPlotLib and then the Data Logging Python software itself.
MySQL is used to store the data from the DataLogger software to provide a database that can be used for later analysis and graphing. The phpMyAdmin software is used to setup and control the MySQL database server and finally Apache is used to serve phpMyAdmin webpages and the DataLogger graphs.
You can install the above software by following the excellent tutorial on the Pi My Life Up website [4].
apscheduler is a very good Python package used to schedule events from within a main Python program running in different threads. This is a better way to run tasks as a hang in one of the threads does not stop the whole system.
sudo pip install setuptools --upgrade
sudo pip install apscheduler
MatPlotLib is a python library for creating professional quality charts using methods similar to MATLIB on the Raspberry Pi. You can output data in formats such as PDF, Postscript, SVG, and PNG.
Install the following packages to continue. Note this will take a long while:
$ sudo apt-get install libblas-dev liblapack-dev python-dev gfortran libatlas-base-dev python-setuptools easy_install scipy python-matplotlib
If you have phpMyAdmin, go to the SQL Tab and copy the contents of DataLogger.sql into the MySQL Box. Hit Go to build the database.
Otherwise, use the following commands:
$ mysql -u root -p < DataLogger.sql
Change the password to something more complex before connecting via port 3306 to the Internet.
Next, copy DataLogger.html to /var/www/html:
$ sudo cp DataLogger.html /var/www/html
Now you are ready to run the full Analog to Digital DataLogger and look at some graphs of your data.
In a terminal window on the Raspberry Pi, type the following:
$ cd SDL_Pi_DataLogger
Now, edit DataLogger.py. Modify the below lines to make sure you're running only the ADS1115 (ADC) software:
what you see in Listing 1. Note that You only get data on Channel 1, as the other channels are floating and will provide unreliable data.
Listing 1
Output from testADS1115.py
01 $ sudo python testADS1115.py
02 --------------------
03 Channel 0 =0.171187V raw=914 raw=0x 392
04 Channel 1 =2.436375V raw=0x32C2 O2 Percent= 22.05
05 Channel 2 =2.577750V raw=0x35B6
06 Channel 3 =0.484875V raw=0x A1B
07 --------------------
08 --------------------
09 Channel 0 =0.171187V raw=911 raw=0x 38F
10 Channel 1 =2.436375V raw=0x32C2 O2 Percent= 22.05
11 Channel 2 =2.570625V raw=0x35B4
12 Channel 3 =0.484125V raw=0x A1A
13 --------------------
14 --------------------
15 Channel 0 =0.170813V raw=908 raw=0x 38C
16 Channel 1 =2.436375V raw=0x32C1 O2 Percent= 22.05
17 Channel 2 =2.574000V raw=0x360D
18 Channel 3 =0.483375V raw=0x A20
19 --------------------
20 --------------------
21 Channel 0 =0.171187V raw=908 raw=0x 38C
22 Channel 1 =2.436375V raw=0x32C2 O2 Percent= 22.05
23 Channel 2 =2.590500V raw=0x35E3
24 Channel 3 =0.485250V raw=0x A1F
25 --------------------
26 --------------------
27 Channel 0 =0.171750V raw=917 raw=0x 395
28 Channel 1 =2.436187V raw=0x32C1 O2 Percent= 22.05
29 Channel 2 =2.573437V raw=0x3611
30 Channel 3 =0.478875V raw=0x A1F
31 --------------------
Next, start the DataLoggerwith
$ sudo python DataLogger.py
and you'll see something similar to what is shown in Figure 6. If you have errors, go back through the setup process once again.
 Figure 6: Output from the DataLogger.py program.
Wait a few minutes, then open your browser and navigate to http://<youripaddress>/DataLogger.html to view your graphs. You can find your IP address by opening Terminal and typing the command:
$ ip addr
You can then read your IP number from the appropriate interface.
Oxygen Burning
For this experiment, we took the Grove Oxygen sensor and placed it inside a sealed glass jar with a lit candle. The idea is to measure the oxygen in the glass jar (Figure 7), watching it go down as the candle burns. After a quick search online, we found that oxygen levels should drop about 30% before the flame is extinguished. This would mean the air inside the jar would go from around 22% oxygen to about 15% oxygen.
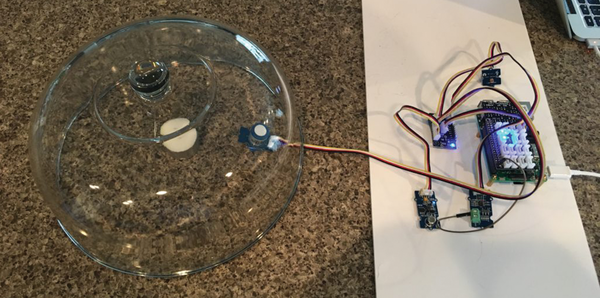 Figure 7: The oxygen project setup.
We set up the DataLogger system to sample the oxygen every second, store the data in the MySQL database and then generate a graph update every minute.
Next, we lit the candle (Figure 8) and watched the data on the browser window connected to the Raspberry Pi.
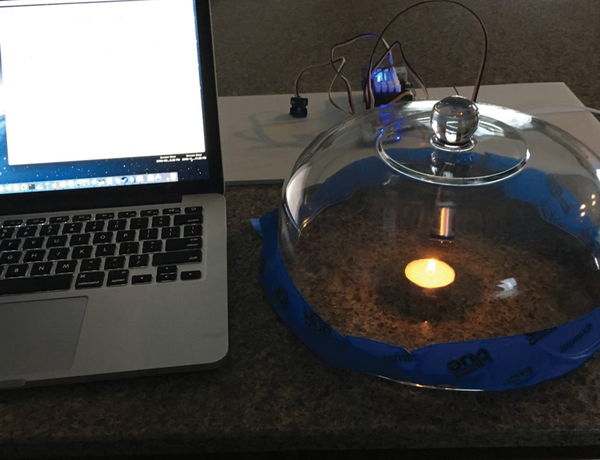 Figure 8: The lit candle.
 Figure 9: The oxygen starts running out.
« Previous 1 2 3 4 Next »
Buy this article as PDF
Pages: 5
(incl. VAT)
Buy Raspberry Pi Geek
US / Canada
UK / Australia
Related content
-
Measuring air quality with the Raspberry Pi

Monitor your environment with a Raspberry Pi and an air quality sensor.
-
IoT on Your Raspberry Pi

The SunIOT project attaches a Grove base unit with a light sensor to a Raspberry Pi to measure various components of the light spectrum.
-
A new way of no-solder prototyping

The Grove system's standardized connector and multitude of devices allow quick and easy project prototyping with your favorite small-board computers.
-
Getting more power from your solar panels

How much extra power can a solar panel collect by tracking the sun? SwitchDoc Labs puts it to the test.
-
Sending your data through the air

Build a low-powered wireless system for your outdoor weather station using inexpensive hardware.
