Using dstat to analyze important system parameters
Data Streams
If you want to know about current system resource consumption, take a look at the network. Depending on the volume of data flow, the kernel and the application can lay claim to computing time. The option combination -n --net-packets allows you to monitor the current load as it is relates to the flow of data over your network (Figure 5).
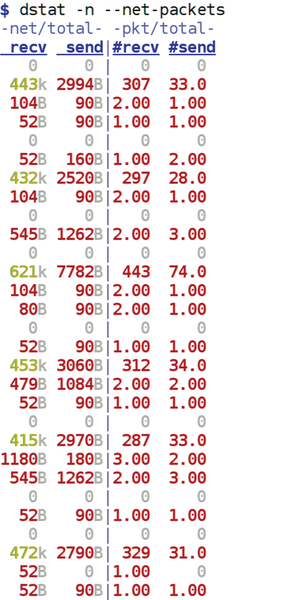 Figure 5: Data streaming over the network can also affect your system.
The net/total area summarizes all of the network interfaces and indicates the bandwidth for the incoming(recv) and outgoing (send) data traffic in increments of Bytes or Kilobytes per time intervals. The pkt/total category refers to the number of data packets received (#recv) and sent (#send) on all network interfaces.
The information found under net/total may provide insight into bottlenecks. For example during testing, the bandwidth for receiving data went up to about 1.2 Mbit/s on a 16 Mbit DSL connection with 2 Mbit/s downstream. This was an indication that there wasn't much virtual breathing room.
Combinations
Each option lets you keep an eye on specific individual resources. If necessary, you can combine various options in order to simultaneously observe things like both the disk I/O and the network load.
The dstat manpage contains numerous additional options for gathering useful information. You could try combining -n --net-packets with the --top-io option for instance, to see what happens. There are also options for Postfix and MySQL.
« Previous 1 2 3 4 Next »
Buy this article as PDF
Pages: 5
(incl. VAT)
Buy Raspberry Pi Geek
US / Canada
UK / Australia
Related content
-
Graphical displays with Python and Pygame

As its name implies, Pygame is a set of Python modules designed to write games. However, many Pygame modules are useful for any number of projects. We introduce you to a few Pygame modules that you can use to create custom graphical displays for your project.
-
Control your data in the cloud with arkOS

ArkOS lets you put your online existence in the cloud without letting your data fall into the hands of commercial data gatherers. The system is easy to administer, and you can expand it using a handy system of extensions.
-
Using Q4OS on the Raspberry Pi for an all-around desktop

When outfitted with a suitable operating system, such as Q4OS, the Raspberry Pi can work quite well as a desktop computer.
-
Making a smart TV with XBMC and a Raspberry Pi

For just a small amount of money, you can turn any television set into a multi-use, smart TV by adding a Raspberry Pi and XBMC. In this article, we will help you start out with the XBMC media center.
-
Evaluate systemd logs using Journalctl

The Journal is a component of systemd that is responsible for viewing and management of log files.
