Measuring and graphing resistance with a PicoBoard and a thermistor
Exporting and Importing Lists
After you get a data set that you would like to graph, it would be a good idea to save that work. Trust me on this one. If you click on your collection script with your mouse, Scratch will run the stack of blocks and wipe out your data, resulting in inadvertent loss.
Fortunately, you can export that list data. To do so, first display the contents of the measurements list by clicking on the checkbox next to the measurements block in the Variables palette to display the list in a stage monitor. The bottom of the stage monitor displays the total number of items in the list. My example has 131 items. Another important point to keep in mind when working with lists in Scratch is that the list starts with item one – not with zero, as is common in many programming languages.
With the measurements monitor displayed on the stage, right-click on the watcher and choose export from the menu. This will allow you to save the contents of the list to a file. Then, if you have any data problems, you can import the list back into Scratch. Importing a list will delete all existing items in the list. Figure 2 shows a sample list with the import and export options displayed.
 Figure 2: Sample list displaying import and export functions.
Graphing the Results
Once you have data in your list, you can graph it. Before you start building this script, you'll need to create a variable named count. You'll use this variable to keep track of your position in the list. To give you an idea of the process, Figures 3 and 4 show a couple of graphs that were made using this script.
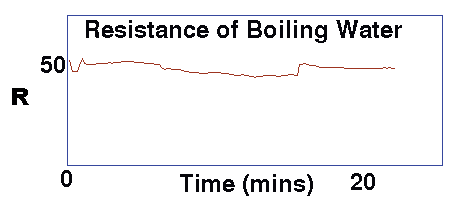 Figure 3: Graph showing resistance of boiling water.
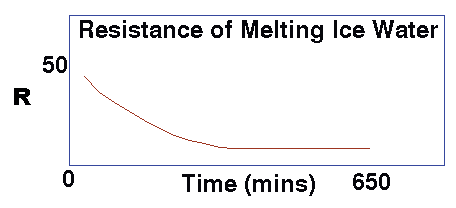 Figure 4: Graph showing resistance of melting water.
The script has three main parts: Initializing the graph, drawing the chart boundary, and plotting the points. For ease of explanation, I'll use those terms in the following discussion. Listing 2 shows the complete script for graphing the points.
Listing 2
Complete Script for Graphing Points
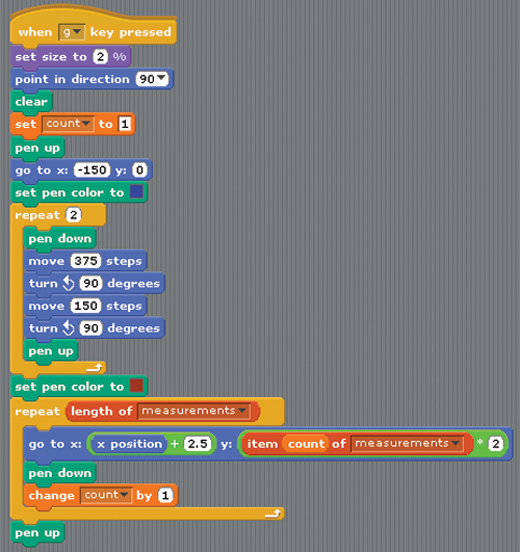
To initialize the graph, make sure the sprite is pointed to the right of the stage, because you're going to use the sprite's movement to draw the boundary of the chart. Thus, you need to make sure the sprite is facing the correct direction. The clear block is from the Pen palette and will remove any pen marks from the stage.
The pen up command ensures you don't actually create any lines as you move the sprite to the starting position, which is defined in the go to x: (-150) y: (0) block. The set (count) to (1) will ensure the graph starts with list item one.
If you look at Figure 3, the blue border of the chart is a rectangle. The sprite will draw this rectangle based on the blocks in the repeat (2) loop. The pen down block instructs the sprite to draw a line as it moves. The two pairs of move () steps and turn counter clockwise () degrees blocks actually create half a rectangle. Repeating the sequence completes the second half of the rectangle and gets the sprite back to where it started.
Next, you need to plot the points. The repeat (length of (measurements)) block controls how many points are graphed by making the number of points equal to the size of the list. The first block in the repeat loop plots the point and starts from the stage (X, Y) coordinates (-150, 0). This point on the Scratch stage becomes point (0, 0) for the graph.
In the graph, resistance values are plotted on the Y-axis, whereas time is represented on the X-axis. For the X position, the script does a simple calculation of x position + 2.5. The x position block is a reporter block that always knows the current X value of the sprite. The value 2.5 scales the graph up and always needs a value greater than 0 so that the point moves to the right of the graph.
For the Y position, the script uses the item (count) of (measurements) block to access the value in the list. The count variable is initialized to 1, and after each list item is graphed, change (count) by (1) increments the current value of count, so that the second pass through the loop accesses the second list item, and so on until the last item is graphed. The list value is multiplied by 2 to scale the graph up, which helps you see the curves better on graphs with subtle changes in resistance values.
The two graphs shown in Figures 3 and 4 are scaled differently in the X-axis, because my boiling water example has 20 points and the melting ice water example has 131 points. You can adjust your values as appropriate.
« Previous 1 2 3 4 Next »
Buy this article as PDF
Pages: 4
(incl. VAT)
Buy Raspberry Pi Geek
US / Canada
UK / Australia
Related content
-
Exploring the PicoBoard sensors

This project uses the slider, light sensor, and resistance sensors on the PicoBoard to connect your Scratch project to the physical world. The two examples create musical fruits and veggies and a PicoBoard joystick.
-
Stop-motion animation

Stop-motion animation doesn't require expensive cameras and movie editing software. With Scratch and a Pi camera, you can become your own director, producer, and publisher.
-
How to create a scrolling sprite project

With the help of an existing project, we show you how to program scrolling sprites in a series or in a continuous loop.
-
Build a simple shooter game

We show how to use Scratch sprites to shoot at various targets.
-
Synchronizing with broadcasts

This article draws inspiration from the popular Pokémon Go app to recreate a sprite hunting game in Scratch. The project explores synchronization and randomness as the player explores various backdrops in search of sprites.
