Turn your Pi into a network monitor and I/O device
There are some great full featured networking packages like Nagios [1] and MRTG [2] that can be installed on the Raspberry Pi. If, however, you are looking for something smaller to play with, then Node-Red might be the answer. Node-Red is a visual programming environment that allows you to create applications by dragging and dropping blocks (nodes) on the screen. Logic flows are then created by connecting wires between the different blocks (nodes). Node-Red also comes with Web Dashboards that allows you to view data or control the app from your smart phone.
In this article we will look at creating some smart phone dashboards that will monitor PCs and control Pi GPIO devices (Figure 1).
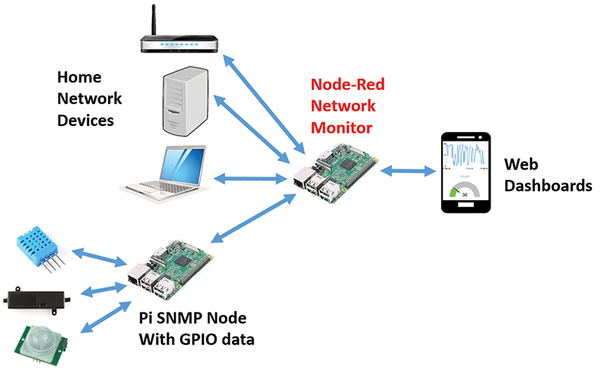 Figure 1: Node-Red smart phone network monitoring.
[...]
Buy this article as PDF
Pages: 4
(incl. VAT)
Buy Raspberry Pi Geek
US / Canada
UK / Australia
Related content
-
Create amazing Pi apps without writing code

Create super easy Pi programs to turn on lights, speak to you, or control motors.
-
Create a streetcar with Lego Mindstorms components and a Raspberry Pi

Wire Lego Mindstorms
-
Add some security to your projects

Blank RFID (Radio Frequency ID) cards along with a USB-based RFID card reader can offer an easy and low cost solution for your Pi security projects.
